Picture this: you've assembled your team to have a risk collection session, perhaps doing a Pre-Mortem, and everyone is really engaging with the process. Suddenly, your simple budget has 30+ risks. You could go ahead and put them all into your DartCannon simulation, but should you?
If you couldn't guess already, the punchline is probably not.
Impact of Risks
Lets create a quick simulation - one line item, and 4 1% probability risks, each 50% of our line item. For most projects, this is a decent representation of a "high impact" risk. Lets look at the result:
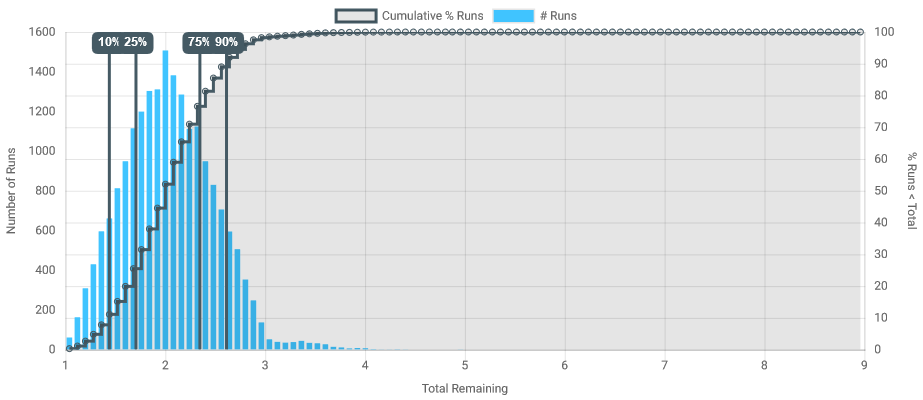
Even running at the highest resolution on DartCannon, over half of the range of the simulation has no results. Try to present this to stakeholders and instead of a productive conversation about hitting the 75% or 90% marks, you'll immediately get sucked into talking about the ~0% chance of being at 7 or 8 on this chart.
This also assumes that you've correctly estimated the chance of these low probability events.
Over-Expecting Unlikely Events
Humans tend to over-estimate the likelihood on infrequent events. Hollywood-style disasters and an over-availability of stories on negative outcomes, combined with the Availability Heuristic lead to over estimating the probability of rare events.
Particularly for high-impact risks, where even small changes in probability can drastically change outcomes, we get into Hollywood disaster thinking and the result to simulations can be the real disaster. Look again at our simulation results. We've estimated our risks at 1%, so there is a 4% chance that at least one of them will occur (100% - 99% ^ 4), which creates the slightly visible results between 3 and 4. But what if the chance was actually 0.1%? Those outcomes would virtually disappear.
Can you and you team accurately estimate the difference between 1% and 0.1%? It could have a big impact on your results.
What Decisions Are Needed?
Central to any discussion of how best to use any estimation tool should be what decisions will be made. Not going to change anything and move ahead no matter what? Don't bother doing any estimating.
The majority of the time you will be making decisions based on estimates - allocating resources, scheduling personnel, or committing funds. The same extends to risks - will including the risk of a meteor impact change your decision making?
Conclusion
Disaster scenarios can be a great way to start a discussion on risks and get a team engaged and you don't want to shut down any creativity. When you go to document those risks and incorporate them into your planning there should be a degree of managerial judgement.
Ultimately, where you set the bar on which risks to include between '1 in a billion' meteor impact and a 75% chance of an incremental charge is a judgement call you need to make. It depends on the decisions needed and the story you're trying to tell.
Photo by Marc Sqeglat on Unsplash
Every week we collect articles from around the web related to probability and estimating in a business context.
Hope everyone had a great week, here's what's been going on in our world!
What We Wrote
- How Correlation Increases Uncertainty - We released Correlated Outcomes and have started digging into its impacts and what you need to know to get the most from your simulations.
- The DartCannon Technology Stack - We pulled the curtain back on the tools and technology components we used to build DartCannon.
What We've Been Reading
- Unmyths of Estimating (G. Alleman on his blog Herding Cats) DartCannon is about estimating. It is good to regularly remind ourselves of why we estimate and the value which comes from the process.
- How Mathematicians Used A Pump-Action Shotgun to Estimate Pi (From the The Physics arXiv Blog) Want a fun example of Monte Carlo in action? Check out this example of calculating PI with a shotgun. Also, it got published as a scientific article!
An end-of-week quote:
So what we need is not Accurate estimates, we need Useful estimates. The usefulness of the estimate is the degree to which it helps make optimal business decisions. (Unmythology and the Science of Estimation, Corvus International, Inc., Chicago Software Process Improvement Network, C-Spin, October 23, 2013)
See something you think we'd like to share? Send an email to weekly@dartcannon.com or connect on twitter, @dartcannon
Photo by Kevin Schmid on Unsplash
Today we want to pull back the curtain on how we built DartCannon and share our appreciation on all the projects that have helped us get here.
The Core
The foundational piece of DartCannon is our custom-build proprietary Monte Carlo simulation engine, Thompson. Under development in some form for over 8 years, Thompson is what enables us to iterate quickly and provide such high quality simulations at an affordable price point. Over the development of DartCannon every other piece of technology has been swapped out for alternatives and likely will be again, but Thompson has been the constant we've built around.
Power Players
With Thompson powering the core of DartCannon, these are the components which drive the main user experience.
- Firebase - Our database and authentication, firebase allows us to not worry about servers or infrastructure.
- Stripe - For payments and subscriptions, stripe means we can be confident that security is all taken care of.
- Vue - There are a lot of javascript frameworks, Vue happens to be the one our team knew and was comfortable using to build DartCannon.
- Vuetify - Vuetify is a fantastic material design framework for Vue.
Supporting Roles
While not as central as our Power Players, these pieces all play important parts driving very specific features.
- Chartjs - Powers all the pretty confidence intervals
- Dagre - Enables process diagrams for projects
- exceljs - The underlying tech for our excel import / export.
Extras
In addition to these components, we have a huge pile of additional pieces we depend on for testing, error handling, screen shots, and more. They are too numerous and detailed for this overview, but we owe them a lot.
Thanks
DartCannon would not exist without the rich open source ecosystem and we are deeply indebted to all of the projects mentioned here.
Photo by Chris Yang Unsplash
When we introduced Correlated Outcomes last week, we mentioned that enabling correlation actually increases uncertainty. This counter-intuitive impact warranted some more examination so you can understand what is happening.
Defining Uncertainty
When it comes to simulations, uncertainty is how tightly packed the outcomes are. For our case, we'll use the middle 80% range.
Simple Simulation
We'll use a simple project simulation, the same as we brought our for our post on the curse of parallel tasks.


Results
For each correlation level, the simulation is run at 100,000 runs in DartCannon to give the following results:
| Correlation Level | Center 80% Range | Center 80% Size | 50% Point |
|---|---|---|---|
| 0% | Between 1.96 Days and 2.74 Days | 0.78 | 2.36 |
| 25% | Between 1.87 Days and 2.73 Days | 0.86 | 2.31 |
| 50% | Between 1.77 Days and 2.71 Days | 0.94 | 2.26 |
| 75% | Between 1.66 Days and 2.68 Days | 1.02 | 2.18 |
| 90% | Between 1.57 Days and 2.64 Days | 1.07 | 2.10 |
| 100% | Between 1.44 Days and 2.55 Days | 1.11 | 2.00 |
Observations
- The Min - Max range is the same for all correlation levels.
- While there is a change for any change in level, the impact is most drastic at the largest levels.
- The higher the correlation, the greater the center 80% range.
- At 100% correlation, the outcome is the same as it would be for a single task.
- For this particular simulation, the center of the results shifts, reversing the effect we described in The Curse of Parallel Tasks.
Discussion
Increasing Uncertainty
To understand the increase in uncertainty, there is a fairly straight-forward way to get an intuitive grasp on the situation. It takes a few steps, but understanding correlations will help understand Monte Carlo simulations in general.
First, the more items in a simulation, either line items or tasks, causes a tighter output compared to the total range. Consider the dice example from My First Monte Carlo - results cluster in the center as there are more ways to create those outcomes, with one high and the other low. The same situation exists in more complex simulations.
Also, correlated outcomes undoes that complexity. In this simple simulation, as we increase correlation, the results get closer and closer to the result from a project with a single task. While a more complex project network wouldn't look like a single task, the idea holds that complexity is reduced.
Taken together, these two ideas show how correlation changes the final uncertainty.
Change in 50% point
This particular outcome does not generalize as obviously as the increase in uncertainty. While in this specific simulation, you can think through how the change to resemble a single task would impact the center, that will break down as simulation complexity increases.
This outcome emphasizes the importance of simulating your outcomes. As we mentioned in the curse of parallel tasks, while possible to intuit individual effects in a simulation, it doesn't take much complexity to make 'thinking it through' practically impossible.
Correlated Outcomes is a Pro feature - Sign up today to get access to correlated outcomes and all the other Pro features.
Photo by Davide Foti on Unsplash
Every week we collect articles from around the web related to probability and estimating in a business context.
With some of the team on vacation, this time it is two weeks in DartCannon - enjoy!
What We Wrote
- My First Monte Carlo - DartCannon makes Monte Carlo simulations easy to use in a business context. In this blog post, we break down this complex tool so you can understand how it works.
- Introducing Correlated Outcomes - It isn't everyday we get to introduce a major new feature! This week saw the introduction of Correlated Outcomes, a powerful tool for modeling complex simulations.
What We've Been Reading
- With Goals, FAST beats SMART (Donald Sull and Charles Sull in MITSloan Management Review) We're big on goals here at DartCannon and how to track progress, so there has been a bit of discussion around this article. One thing that stood out to us is what is shared between FAST and SMART - the 'S' for 'Specific'.
- Black Swans (G. Alleman on his blog Herding Cats) Everything Glen writes immediately goes on our 'must-read' list and this post is no different. We plan to tackle the application of black swans ourselves at some point, but this is a good discussion of how people get wrapped up in low probability events that they stop doing planning. Well worth a read.
- A new study compared formal and informal communication at work, and the results are no fun
(O. Stanley at Quartz)
Here's the key quote:
...informal communications channels come with a cost. Manufacturing systems that use formal methods of communication, like meetings with set agendas and required participation, are more efficient and have fewer errors than those that rely on emails and phone calls.
DartCannon Development Spotlight
We are constantly continuing to improve DartCannon and while the majority of changes are too small to call out, we want to highlight larger improvements.
We already highlighted that this week saw the introduction of Correlated Outcomes, but there are other minor changes as well!
Cleaner New Simulations
A new simulation used to be full of warnings, with every part of the results complaining that it couldn't show anything. We've now cleaned that up so a fresh simulation is more of a blank canvas, ready to be created.
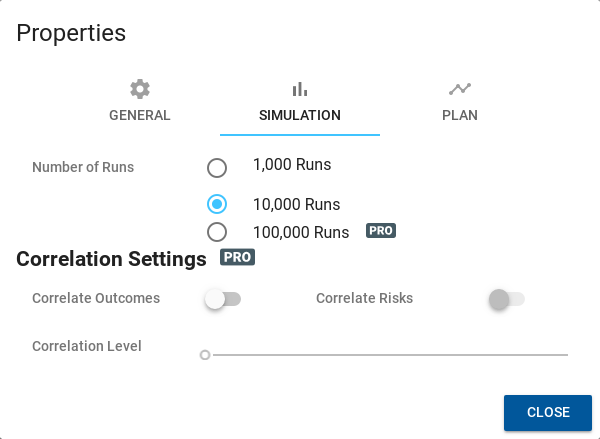
Improved Simulation Settings
Adding Correlated Outcomes to simulation settings (accessible via the menu when editing a simulation) caused us to redesign the settings dialog. It had been pretty cluttered so to add the correlation properties necessitated a cleanup. It should be much nicer to use now.
Pro Badging
Previously, if you did not subscribe to a paid plan, you wouldn't always know when an action would ask you to subscribe it you'd hit a limit. Now, we have consistent markings for which features require a paid plan so it should never be a surprise.
An end-of-week quote:
“Acquiring Data Retires Risk.” - Glen B. Alleman
See something you think we'd like to share? Send an email to weekly@dartcannon.com or connect on twitter, @dartcannon
Photo by Iñaki del Olmo on Unsplash