Getting Started
Welcome to DartCannon! This tutorial will show you the basics of probabilistic estimating.
Creating Your First Simulation
As soon as you log into DartCannon, you'll be presented with your list of simulations. You may have some simulations already or it could be empty, as pictured here.
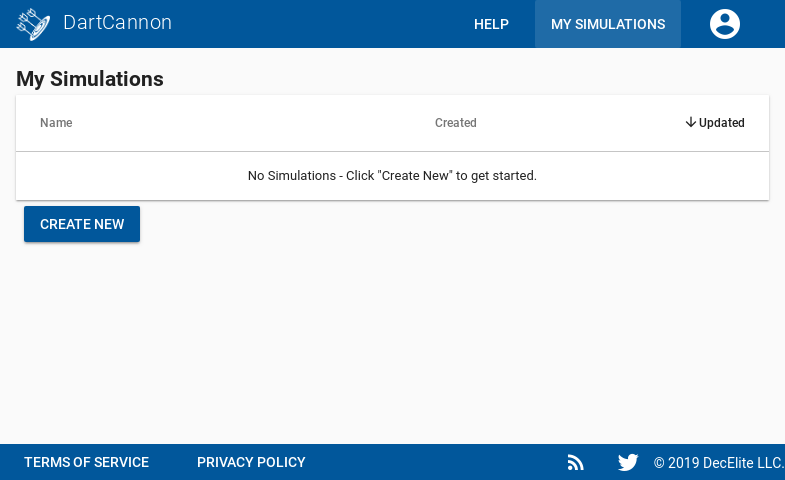
To create a simulation, click 'Create New'.
Note: If you have a free account and already have 5 simulations, you'll instead be prompted to sign up for a paid plan.
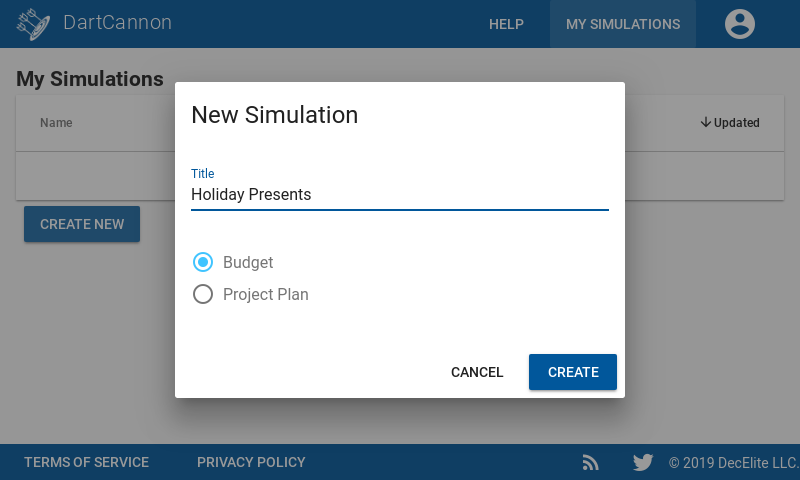
Because it is easier to get started, our first simulation will be a Budget and to connect it to something real, we'll simulate the budget for holiday presents to figure out how much we need to save.
Once you enter the title, click 'Create' and you'll be taken to your new simulation.
Adding Items
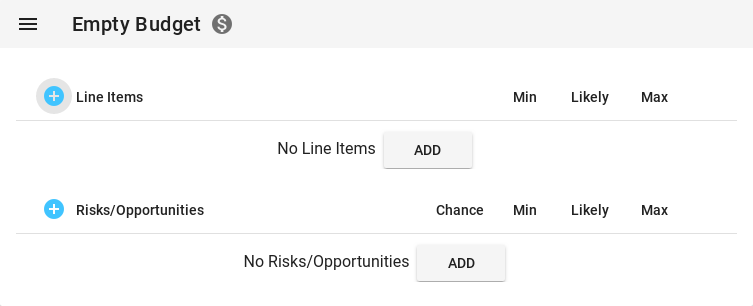
A new simulation isn't terribly interesting as there are no items in it yet. For a budget, each item represents a line item we'll estimate the cost for. In this holiday gift example, each line will be a gift we want to purchase.
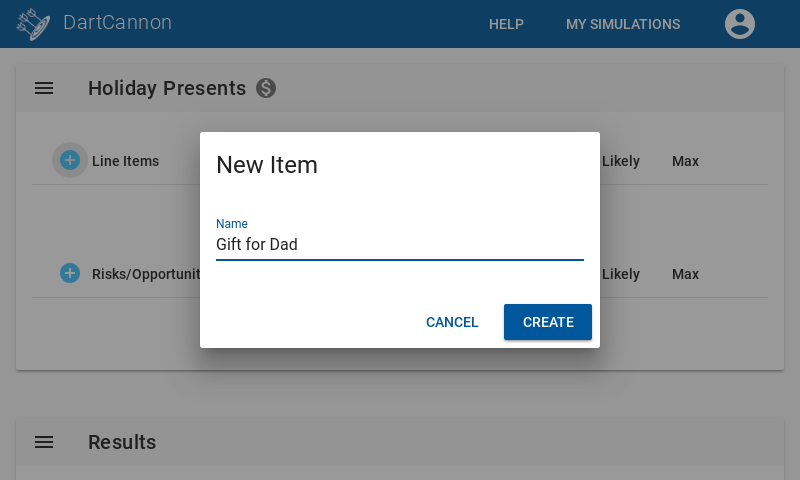
To add an item, click the '+' next to 'Items', then enter the name. Enter "Gift for Dad" as the name and click 'Create'. If you mistyped the name, you can just click on the item name to open a dialog to rename it.
Setting Estimates
Each Item has 3 estimate paramteters - Min, Likely, and Max.
- Min - Absolute lowest the item could be
- Likely - Most likely option for the item
- Max - Absolute maximum
You can see in the results what this looks like in the results - it forms a triangle that goes from the minimum to the maximum, peaking at the most likely.
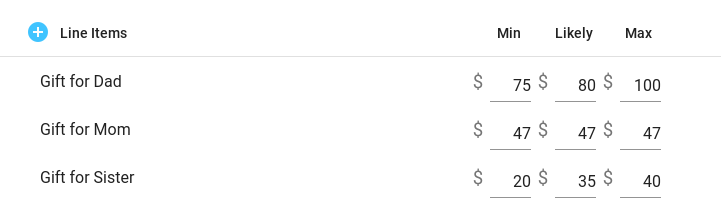
For the "Gift for Dad", we don't know exactly what we'll be getting him but we'll spend between $75 and $100, aiming at $80 as the most likely.
You can see that DartCannon checks inputs will not update results if you have errors. It makes sure that the Minimum is less than or equal to the Most Likely which is less than or equal to the Maximum.

Lets add a few more items:
- "Gift for Mom" - We know exactly what we're going to get, so enter $47 for Min, Likely and Max
- "Gift for Sister" - Lets aim to spend between $20 and $40, with $35 Most likely.
After adding all items and setting the estimates, your item sections should look like this:
Creating A Risk
Before we look at the results in depth, there is a chance that you'll also need a gift for your cousin who thinks there is a 20% chance he'll be with you for the holidays.
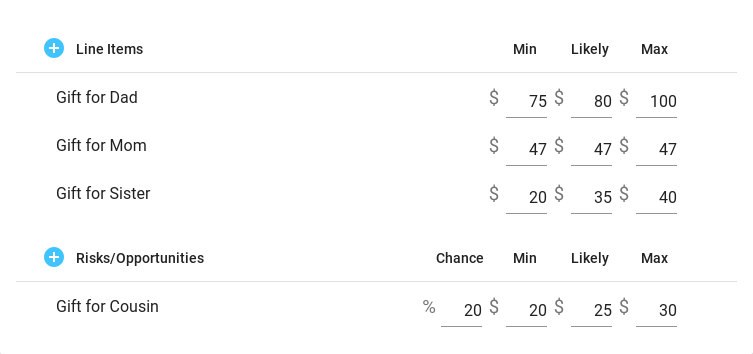
To add this to your model, since it is uncertain that this will happen, we need to add it as a risk. Risks are like items only they have a probability of occurring. Click the '+' next to 'Risks', enter 'Gift for Cousin', click 'Create'. Now that you have the Risk, set the estimate parameters to be 20%, $20, $25, and $30.
At this point your simulation should look like this.
Understanding the Results
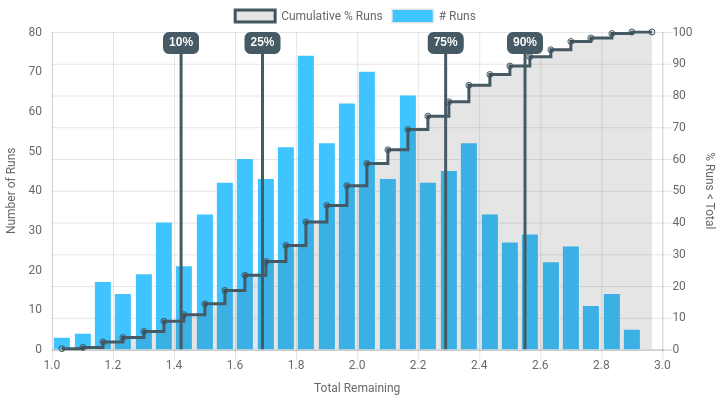
Your results will look something similar to this:
It won't look exactly the same because the result is made up of randomly picking values for each of our items and risks based on the esitmate parameters we entered. Right now, it does that 1,000 times and then shows the results. Even for our simple example, 1,000 runs isn't enough to cleanly show the result. To increase the runs, click on the menu and change to 10,000 runs. You can go up to 100,000, but that requires a paid account.
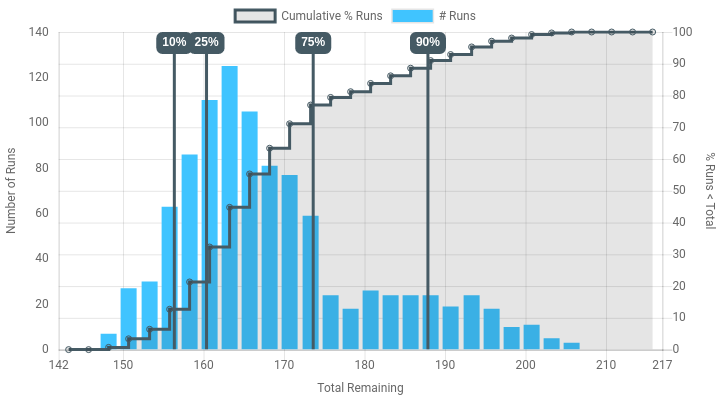
The results will look smoother now, but the tradeoff is that it takes longer to run. As you resize the window, the chart will adjust to be optimized for the size. For instance, after increasing the runs and increasing the size of my browser, the chart looks like this:
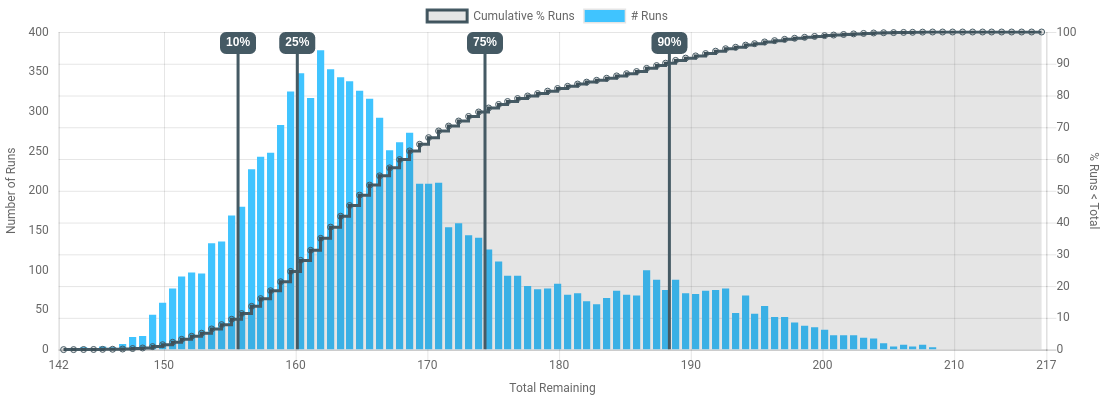
You can notice that while we put in a bunch of triangles, we now have a far more complex shape. This is because sometimes one is low, the others are high or sometimes our cousin comes and sometimes he doesn't.
We can also see that we rarely spent the absolute maximum or minimum, but rather we're clustered near the middle. The annotations on the chart show us how the simulation outcomes are clustered.
Because we're concerned bout having enough funds, we'll also switch the probability ranges to show "Left-hand probabilities", or the chance our simulation will be under a particular amount. If we were running a sales forecast, we'd likely be more interested in probabilities we'd be over a given amount, so we'd use "Right-hand probabilities".
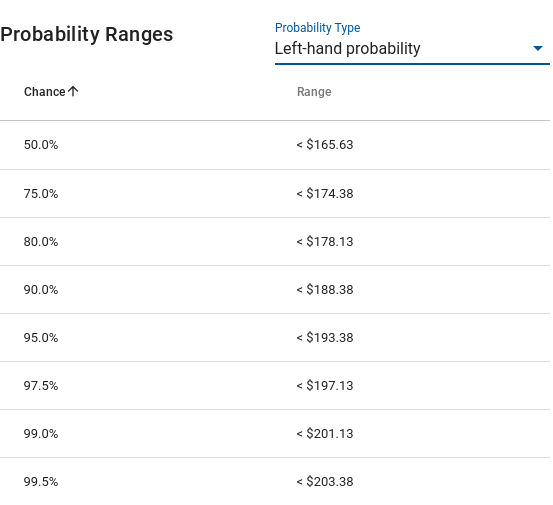
How much we want to save now depends on our risk tolerance. For instance there is a 5% chance we could cover our holiday gifts if we save $153, but we're 95% confident we'll be covered if we save $194.
Congratulations!
You have run your first simulation and gotten results that are impossible with a traditional spreadsheet.
Next Steps
Things to try
Other docs to look at